India’s ecommerce market has expanded rapidly over the past decade, and there is still considerable room for growth. The country’s e-retail market reached around $65–66 billion in GMV in 2025 and is expected to reach $170–180 billion by 2030. A growing base of online shoppers, wider smartphone and internet access, digital payments, and rising ecommerce adoption beyond metro cities are all contributing to this growth.
For D2C brands, however, a growing market does not automatically translate into sustainable growth. Where customers are coming from, how they discover products, which channels they prefer, how they pay, whether orders get delivered, and how often they return all matter.
In this blog, we will look at 15 ecommerce growth statistics that can help D2C brands understand changing customer behaviour, identify emerging opportunities, and make better decisions.
How we selected the data: The statistics below are drawn from 2025–2026 India-focused reports and datasets published by Bain & Company and Flipkart, Unicommerce, IAMAI and Kantar, Meta and the Retailers Association of India, Worldpay and Google. Where a figure comes from a specific platform dataset or consumer survey, we have noted that context rather than treating it as a universal market benchmark.
1. India’s E-Retail Market Reached $65–66 Billion in 2025
India’s e-retail market reached $65–66 billion in GMV in 2025, growing around 19%–21% year over year. The market is expected to cross $170–180 billion by 2030 if current growth continues.
For D2C brands, this gives a useful benchmark. Growing sales is good, but performance should also be compared with how quickly the overall category and e-commerce market are expanding.
If the market is growing at close to 20% while your business remains flat, it is worth looking deeper into acquisition, conversion, pricing, product demand, and repeat purchases.
2. India Has Close to 300 Million Online Shoppers, But There Is Still Plenty of Room to Grow
India’s e-retail shopper base has more than doubled in five years, from roughly 140 million in 2020 to 290–300 million in 2025. Yet only around 30% of the country’s internet users currently shop online.
The customer base is already huge, but e-commerce has yet to reach a large share of Indians who are online. Bain estimates that the majority of India's next 500 million online shoppers are already in the digital funnel. Around two-thirds of chat and social-media users are not yet shopping online.
For D2C brands, future growth can come from bringing existing internet users into online shopping, particularly outside the largest cities.
3. D2C Order Volumes Grew Faster Than Prices in FY26
India’s D2C sector grew mainly by selling more products rather than charging more for them.
Unicommerce recorded 34% growth in D2C order volumes and 33% growth in GMV during FY26 across data covering more than 6,000 brands and 410 million shipments.
When order volume grows faster than GMV, operational capacity becomes increasingly important because more orders create additional payment, fulfilment, support, refund and reconciliation work. More sales also mean more payment attempts, shipments, customer queries, refunds, returns, and reconciliation.
Scale depends on how efficiently those additional orders are processed.
4. Tier 2 and Tier 3 Cities Drove 66% of Incremental D2C Orders
The next D2C customer is increasingly likely to live outside a metro.
Tier 2 and Tier 3 cities contributed 66% of incremental D2C order volumes in FY26.
Brands expanding beyond metros should compare COD share, delivery time, RTO, shipping costs, conversion, and repeat purchase rates across city tiers rather than looking at order volume alone. Another region may produce fewer orders but better prepaid adoption and repeat purchases.
Look beyond order volume and compare conversion, AOV, payment preferences, shipping costs, delivery success, and repeat rates across city tiers.
5. Gen Z Now Makes Up 40%–45% of India’s Online Shoppers
Gen Z has become one of the largest ecommerce customer groups in the country.
People born between 1997 and 2012 now account for 40%–45% of India’s e-retail shoppers and nearly half of incremental e-retail orders.
Their shopping behaviour also makes discovery more distributed. Social media, influencers, videos and feeds play a greater role in what they find and eventually buy.
For D2C categories such as fashion, beauty, lifestyle, food and electronics, the buying process may begin well before someone lands on a product page.
6. One in Four New Online Shoppers Is Added During the Festive Period
Festive sales remain one of the biggest acquisition periods for Indian ecommerce.
Around one in four new e-retail shoppers was onboarded during the September–October 2025 festive period.
For D2C brands, the bigger opportunity comes after that first discounted purchase.
Track how many festive customers return after 30, 60, and 90 days. A sale that adds thousands of first-time buyers can create long-term value when those shoppers come back without needing the same level of discounting each time.
7. Older Online Shoppers Are Now Buying More Than Twice as Often
Growth does not have to come entirely from new customer acquisition.
Shoppers who first came online in 2020 were making more than twice as many transactions per customer by 2025. They were also buying across more categories than when they started.
That makes repeat behaviour an important growth metric for D2C brands.
For replenishable products such as skincare, food, supplements, personal care and household essentials, track the average time between orders. Knowing when customers typically run out of a product can help brands time reminders, offers and replenishment messages more effectively.
8. Health and Pharma Was the Fastest-Growing D2C Category in FY26
Not every D2C category is growing at the same pace.
Unicommerce recorded 48% growth in Health and Pharma, followed by 41% in Beauty and Personal Care, 32% in FMCG, 21% in Fashion and Accessories, and 19% in Home Furnishings.
Purchase frequency helps explain part of the difference.
Replenishable categories such as skincare, nutrition, and packaged food tend to create more frequent repeat-purchase opportunities than categories such as furniture.
This is why a brand should compare its repeat rate, purchase frequency, and growth with businesses that sell similar products rather than relying on one D2C benchmark.
9. Quick Commerce Already Accounts for 16%–17% of India’s E-Retail GMV
Quick commerce reached around $10–11 billion in GMV in 2025 and now contributes approximately 16%–17% of Indian e-retail GMV. It has roughly doubled every year over the past two years.
For D2C brands, that creates another distribution option, especially in categories where customers purchase frequently or need products quickly.
Beauty, personal care, food, beverages, household products and daily essentials are obvious candidates.
The decision should still come down to margins, average order value, inventory requirements and whether faster delivery actually matters to the customer.
Short-form video has become one of India’s largest digital behaviours.
Around 588 million internet users watched short-form video in 2025, equal to roughly 61% of active internet users. Rural viewers slightly outnumbered urban viewers.
For D2C brands, video can do much more than generate awareness.
It can show how a product works, demonstrate texture or fit, explain the difference between variants, answer common questions, and give shoppers a better sense of what they are buying.
A good product video can also be reused across social media, product pages, creator content, and marketplaces.
Product discovery increasingly starts while customers are scrolling.
A 2026 Meta and Retailers Association of India study found that 77% of retail brand and product discovery among surveyed consumers happened through social media. Short-form video and creators were major parts of that behaviour.
For D2C brands, this means measuring only direct sales from social media can underestimate its role.
Someone may discover a product through a Reel today, search the brand tomorrow, read reviews, and finally purchase through the website or a marketplace.
Referral traffic, branded searches and assisted conversions can provide a better picture of how discovery turns into sales.
12. E-Retail Ads Now Take Around One in Four Digital Advertising Rupees
As more shopping happens online, advertising budgets are following.
E-retail advertising accounted for roughly 25% of India’s digital ad spend in 2025, up from around 18% in 2023.
Marketplace search ads, sponsored listings and retail media put products in front of shoppers who are already browsing or comparing options.
For D2C brands selling across their own website and marketplaces, this makes channel-level profitability more important.
Look at contribution margin and customer value alongside ROAS. A channel can generate plenty of sales while becoming expensive once marketplace fees, advertising costs and discounts are included.
13. Digital Wallets Account for 68% of India’s Ecommerce Spending
The Indian checkout is heavily digital.
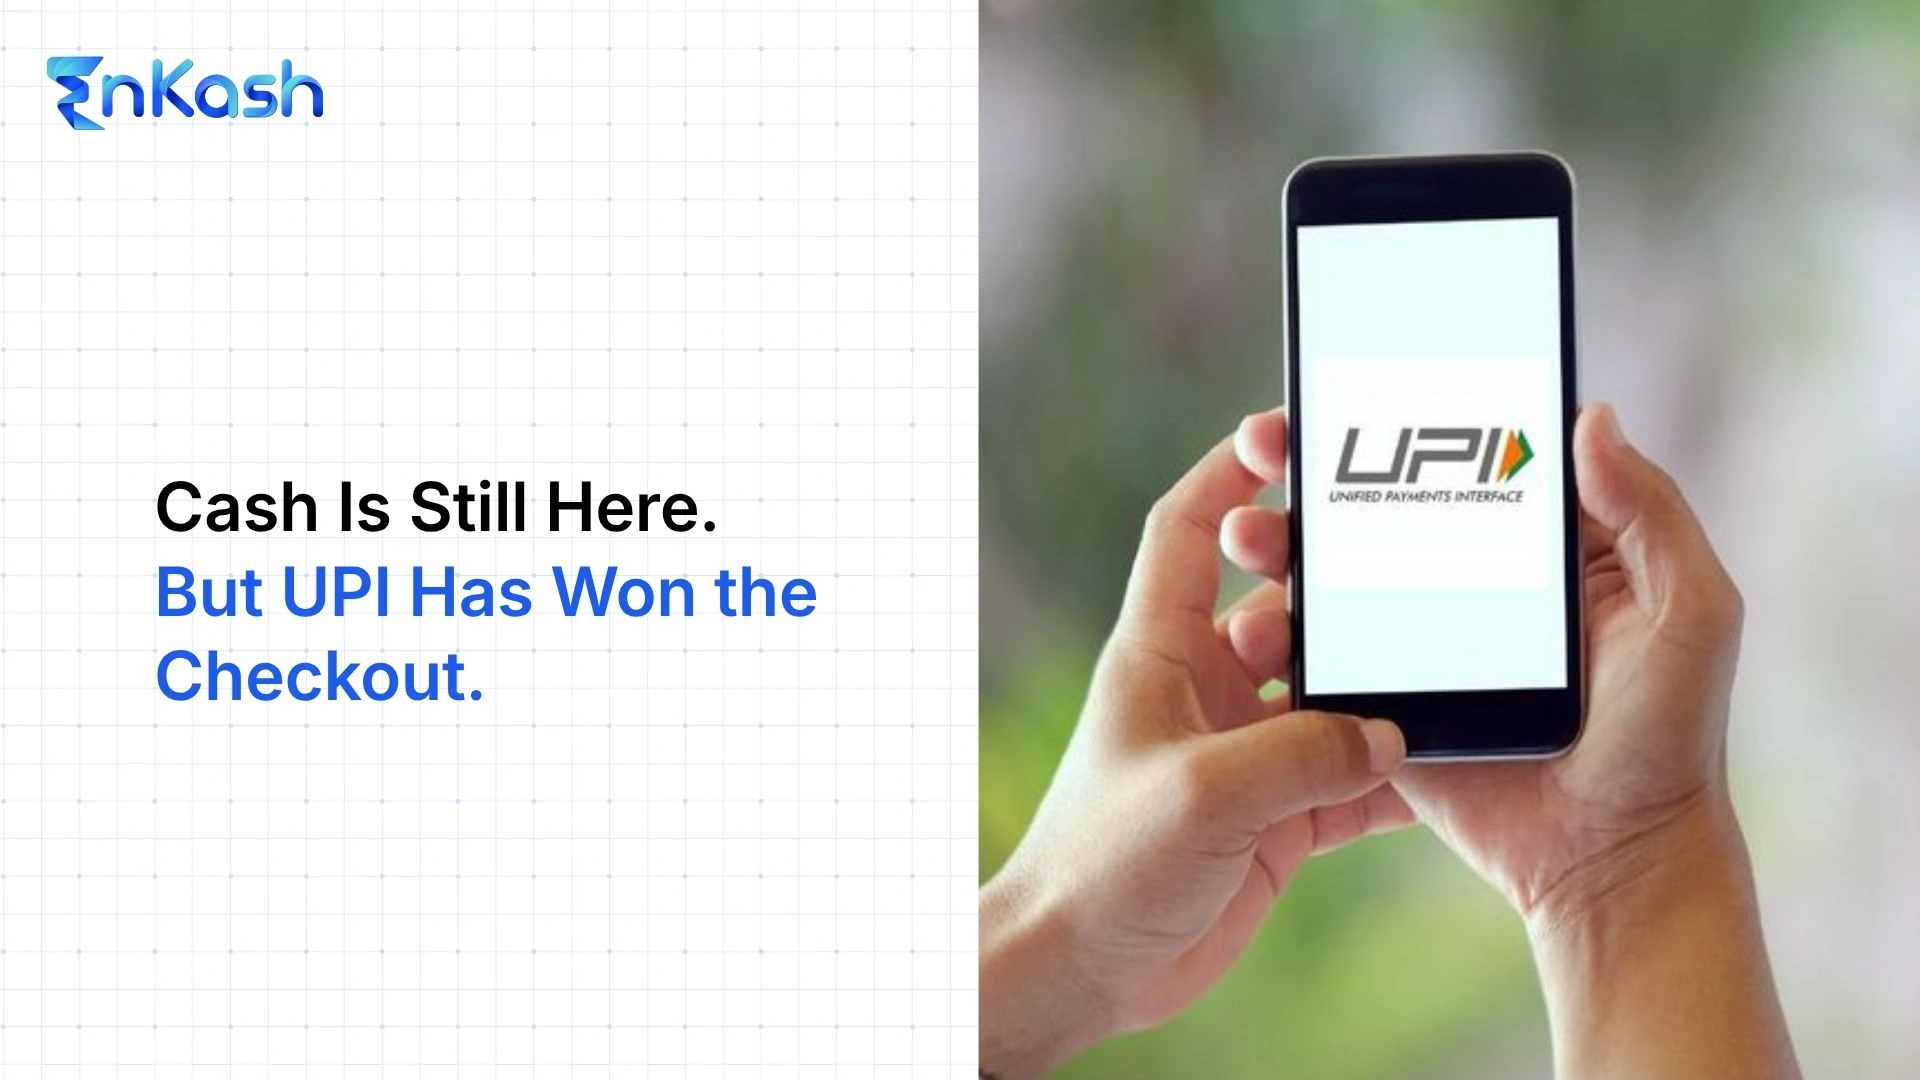
Digital wallets accounted for 68% of ecommerce transaction value in India in 2025, with UPI playing a major role in the country’s wallet-led payment ecosystem. Cards represented another 21% of online spending.
For D2C brands, the lesson is simple: payment options should match the way customers already prefer to pay.
Brands should also track payment success separately for UPI, cards, and other methods. An overall payment success rate can hide a problem affecting one specific payment option.
14. COD Orders Can Have a Much Higher Return Rate Than Prepaid Orders
COD can make online ordering accessible to shoppers who prefer to pay at delivery, but its economics can look very different after fulfilment.
During the festive period covered by Unicommerce’s FY26 data, 58% of COD orders were returned, compared with less than 15% of prepaid orders.
That gap affects shipping costs, reverse logistics, inventory availability and margins.
The answer is not necessarily removing COD. Brands can test prepaid incentives, address verification, delivery confirmation, and pin-code-level RTO analysis to identify which customers and locations carry the greatest risk.
Placed orders and successfully delivered orders should always be measured separately.
15. 45% of Surveyed Indian Shoppers Are Comfortable Letting AI Buy for Them
AI is moving closer to the purchase itself.
Around 45% of surveyed Indian shoppers said they were comfortable allowing AI to purchase products on their behalf as long as they were informed before the final transaction.
AI-assisted product research is already becoming more common too. Among Indian shoppers using Google AI Overviews or AI Mode for shopping, 84% said it helped them make decisions faster and 87% felt more confident about those decisions.
D2C product pages therefore need to be easy for both people and machines to understand. Product names, prices, specifications, variants, reviews, availability, delivery information, returns and comparisons should be explicit rather than buried inside images or vague copy.
eCommerce Metrics D2C Brands Should Track
Industry statistics tell you what is happening around your business. Your own numbers tell you whether you are benefiting from it.
| Metric | What It Tells You |
|---|
| Conversion rate | How many visitors complete a purchase |
| Add-to-cart rate | How often product interest becomes buying intent |
| Checkout completion rate | How many checkout starts become orders |
| Payment success rate | How many payment attempts are completed |
| Prepaid order share | How much of your business gets paid before delivery |
| COD share | How dependent the business is on pay-on-delivery |
| Average order value | Average amount spent per order |
| Customer acquisition cost | Cost of acquiring a new customer |
| Repeat purchase rate | How many customers buy again |
| Time to second purchase | How quickly first-time customers return |
| Customer lifetime value | Revenue generated by a customer over time |
| RTO rate | Orders that fail to reach the customer |
| Return rate | Delivered products later returned |
| Contribution margin | Revenue remaining after variable order costs |
| Revenue by city tier | How demand differs across locations |
A 30% increase in order volume does not automatically mean the business has become 30% healthier.
RTO can rise at the same time. Acquisition can become more expensive. Discounts can increase conversion while reducing margins. A large share of newly acquired customers may never make a second purchase..
The strongest D2C brands watch acquisition, conversion, payments, fulfilment and retention together.
Conclusion
India’s ecommerce market still has considerable room to grow, but the opportunity is becoming more distributed.
More customers are shopping from Tier 2 and Tier 3 cities. Gen Z is influencing what gets discovered and purchased. Social content and short-form video are becoming important parts of product discovery. Quick commerce is adding another route to customers, while UPI-led digital payments are shaping how online orders are completed.
There is another side to growth too.
Traffic, order volume and customer acquisition only create durable growth when visitors convert, orders are successfully delivered and first-time buyers return.
That is why D2C brands in 2026 should look beyond GMV alone. The numbers that matter most are the ones that show how efficiently demand turns into delivered orders, repeat customers and sustainable revenue.